I blogged about the concept of "Davis Double Play" (here ) and explained that there are two very important components in determining the index of stock markets i.e P (Index)= EPS x PE
Now, after the start of QT, we continue to see the market is adjusting to the "market expectation" of PE and compressing the PE to a more reasonable level. More and more data points showed that the US economy is slowing down from " Real Retail Sales, Housing Starts, Philly Fed Manufacturing Index, Empire State Manufacturing, etc.."
ECRI Weekly Leading Index Update < Sources: advisorperspectives.com>
With such a high inflation data, the Consumer Sentiment by the University of Michigan also at a level never seen after GFC( Global Finance Crisis ), now is much lower than during the Covid-19 pandemic time.
University of Michigan: Consumer Sentiment (UMCSENT)
It seems that the US economy heading towards recession is "inevitable" with FED turning more "hawkish" after the 0.75 % rate hikes in the latest FED FOMC meeting.
I think the market may continue to be volatile and have pressure on lower-earning ( EPS) if the recession really hit and affects the overall consumer spending which accounted for more than 75% of GDP. I guess there will be a trade-off needed when your income remains unchanged but the higher gasoline price taking up more of your disposable income, the spending on other items may need to be cut or reduced.
This may eventually be reflected in companies' earnings and the stock indexes in the coming quarters, as such, we may see more downward pressure on indexes in view of lower EPS reported.
As of now, NASDAQ is down by -34% from A.T.H (all-time high ) and -24% for S&P 500.
When you want to add a trendline to a chart in Microsoft Graph, you can choose any of the six different trend/regression types. The type of data you have determines the type of trendline you should use.
Trendline reliability A trendline is most reliable when its R-squared value is at or near 1. When you fit a trendline to your data, Graph automatically calculates its R-squared value. If you want, you can display this value on your chart.
OK, since we believe that the earning growth for US Mega-Cap companies like Alphabet/ Amazon/ Tesla / Microsoft /Meta and others are growing at an exponential/accelerated rate for decades, I have decided to change the measurement of Trendline to "Power " instead of "Linear".
"A power trendline" is a curved line that is best used with data sets that compare measurements that increase at a specific rate — for example, the acceleration of a race car at one-second intervals. You cannot create a power trendline if your data contains zero or negative values.
In the following example, acceleration data is shown by plotting distance in meters by seconds. The power trendline clearly demonstrates the increasing acceleration. Note that the R-squared value is 0.9923, which is a nearly perfect fit of the line to the data.
Here is the result :
** Based on this new "Power" Trendline, the current value of the long-term trend moves upward to
3,200 instead of around
3,000 by using a linear Trendline.
*** Market will need another -13% to reach the long-term trend line.
Ok, nobody really knows how the market will move eventually and if the market may rebound from here or going to drop further. We don't have the crystal ball to predict and is really hard to catch the bottom, but if you do believe that the US tech companies ( especially those Mega-cap with strong cash flow) still have a future and may rebound eventually once the economic situation improves, now may be time to do some searching and start with a small position, with tranche.
But again, with increasing FED rate and QT ( Quantitative Tightening) in place, the market will continue to be volatile, please DYODD and have a plan to ensure that you are investing for the long term not speculative. The companies your select must have a strong fundamental and predictable cash flow, I think those NO P/E and HIGH P/S start-up companies may or still have room to drop further because of the drying up of liquidity.
Talking about "speculative stocks", there is another highly speculative asset class i.e " Crypto Currency" also been badly hit recently. Bit-coin drops by more than -42% for the past 1 month and it drops by almost -73% from A.T.H at around $67,582 to now at $18,277 as of writing this article.
My friend ask me to plot the "Regression Chart" for Bit-Coin and I told him that since Bit-Coin is an "alternative asset class" where we can't do the valuation in a traditional way e.g DCF/ PE / PB or Sum Of Total etc.. There is no underlying asset that generates cash flow for such crypto asset, hence the "reversion to mean" may not practically apply here.
Ok, just for "fun" I have plotted the chart as below, please don't take this as an indication as I mentioned earlier, there is no way to do the "valuation" for Crypto, and the "Mean Reversion" trend line may not apply here as like "stock market" indexes where it still has business for companies under such index.
** If drops below -1SD ( light green line), the next support level will be -2SD at around $11,362.
(please don't take this seriously)
Ok, enough kidding and TCSS, back to SG STI and SG REIT :)
STI finally end this week at -1.28% YTD with banks and REITs also dropping quite a lot. If you look at the trend line, it is still far from "crisis level", not really cheap for me to add more at this moment.
But as mentioned, If you are in the "wealth accumulation" stage and still young and going to invest for a very long time horizon, this could be a good timing/ opportunity to do DCA as the index is moving below the long-term trend line.
How about SG REIT?
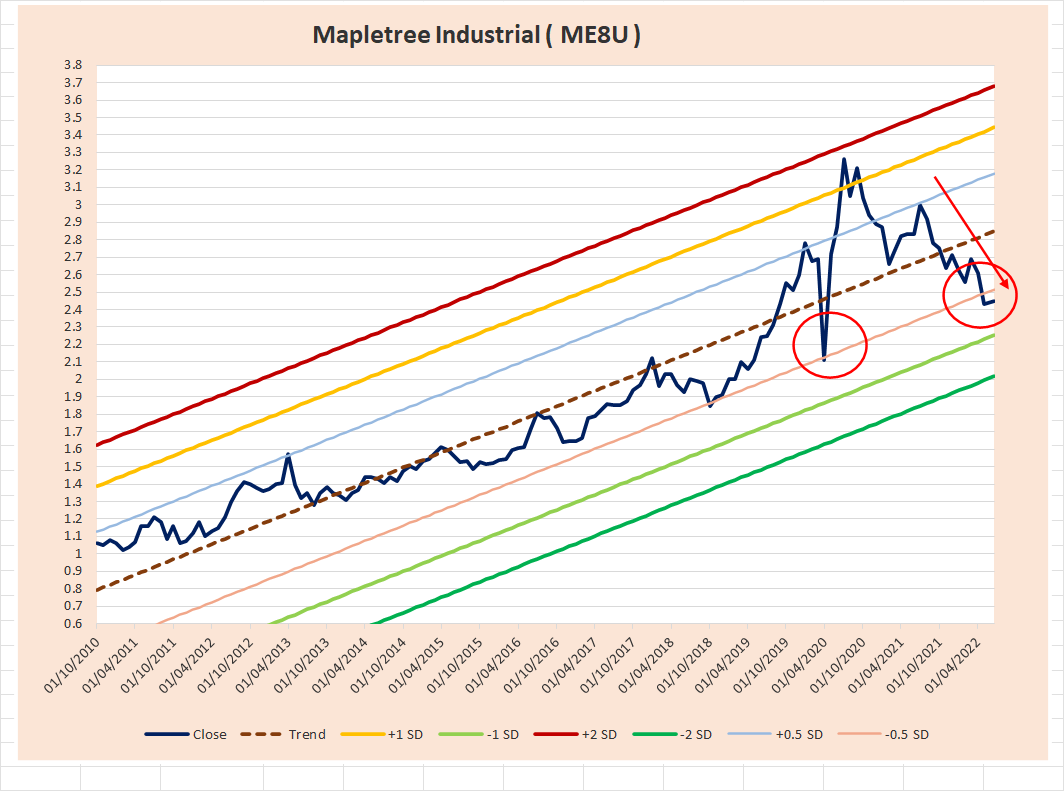
Well, FTSE REIT looks more interesting as it drops almost -7% YTD and moves towards the -0.5 SD line.
You may notice that the index moves tightly along the +/- 0.5 SD line, with 3 exceptions that it drops below this line i.e 2008/09 ( GFC ), 2011 ( European Debts Crisis ), and 2019/20 ( Covid-19 Pandemic ).
As you know, I have trimmed my exposure in SG REIT a few years back and now only have less than 12% in my total portfolio. I am now considering increasing the % of SG REITs in my portfolio as the stock prices for some of these so-called "blue-chip" REITs has dropped quite a lot in the recent month due to interest hike. I may slowly pick up some if prices drop further where I think it starts to look interesting. I believe that hard-asset like "REITs" will still be a good "hedge" for inflation in the long run and perform better than "cash", while in the short-term it may continue to look volatile.
This is not a recommendation to buy or sell, please DYODD!
Happy Father's Day and till the next update!
Cheers !!
STE


Comments
Post a Comment