"Davis Double Play" : Mr. Market & Asset Bubbles
The last two weeks must be a hectic week for Crypto investors as we had seen the collapse of Luna ( A type of stable coin) which wiped out almost $40 Billion of market cap from the Crypto-market.
What is Terra Luna? Why did it Crash by 99.9%? <Sources:business2community.com>
As I mentioned before, Crypto as a so-called "alternative asset " class is very risky and may not be suitable for all investors, especially for those with low-risk tolerance.
Bitcoin as the "King " of Crypto may not collapse like "Luna " since it still has demands on certain "usage " like "currency" for some groups of people, but we may continue to see the huge fluctuations of the price like up and down of more than +/- 50%. For some other coins like "Luna", it will not be that lucky to enjoy such "privilege" and I am sure, "Luna" will not be the last of such coins to collapse, there will still be some to follow Luna's steps from time to time. Even those "stable coins" with collateral assets, it still subject to "counterparty risk" and asset quality which may not be able to verify. Investors for Crypto may need to understand the "High Risk-High Return" kind of trade-off. One must also need to ensure that you have enough "buffer" to cushion any downfall such as "Luna" no matter how strong your convictions are on these kinds of asset classes.
For those losing money in "Luna", don't give up on your investment and move on. Take this as part of the learning lesson in your investment journey. We all make mistakes from time to time, including me, I lost big in Hyflux CPS and Eagle Hospitality Trust due to greed and I am sure these will not be the last for me. There is no so-called "year of experience" in investing, we need to pay attention to all the pitfalls and value-trap and be open-minded to all the comments & criticism.
Bitcoin ( Crypto) Is Not Tulip <Link>
Davis Double Play: Understand the Asset Bubble & Market
Not all Bubble Are Created Equal!
Depending on asset class, some bubbles may recover and some may not. A good example is "Tulip and Luna ", both belong to asset classes that are "hard " to analyze from the valuation perspective, on the contrary, the asset classes like Equity or Property also tend to have "bubbles" from time to time ( like 2000-Dot.com bubble/ 1980s Japan Property Bubble ), although the crash is also severe, it may recover at some point in future as long as the underlying asset still have value and continue to generate cash-flow. This is a stark difference between each asset class that may react differently during the "Bubble & Burst " market cycle.
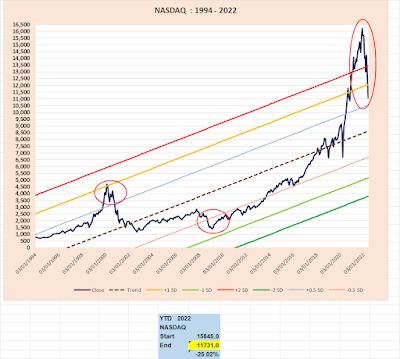
There was a typical "Bubble & Burst" situation for Nasdaq in 2000 and it took almost 15 years for Nasdaq to recover and hit the previous height level in 2015 again. As explained earlier, for such an asset class, even if we enter at the All-Time High ( ATH) level of the index, we may still have a chance to recover if we are holding to it "long enough", well the caveat here is the keywords of "long enough", provided you don't jump-ship in half-way during the 15 years waiting time.
I am sure Nasdaq will be able to recover and exceed the last ATH of 16,212 in the future, but I just don't know when. It could be shorter than 15 years from the previous ATH, depending on the earnings of companies under this Index.
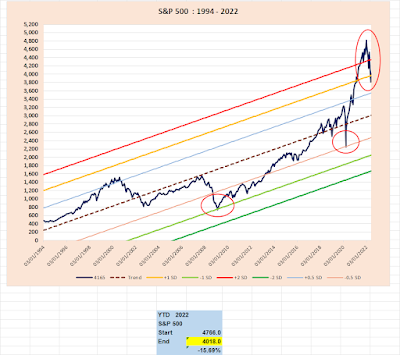
A similar trend for S&P500 where correction is not as severe as Nasdaq, where Nasdaq is more towards Mega Cap Tech plus many no earning - high PS start-up companies.
Who is Shelby Cullom Davis ( Davis Double Play )?
The Greatest Investor You’ve Never Heard Of <source:thegoodinvestors.sg>
"I first learned about Shelby Cullom Davis some time in 2012 or 2013. Since then, I’ve realized that he’s seldom mentioned when people talk about the greatest investors. This is a pity because I think he deserves a spot on the podium alongside the often-mentioned giants such as Warren Buffett, Benjamin Graham, Charlie Munger, and Peter Lynch."
The Classic Davis Double Play <source:valuewalk.com>
Shelby Davis was a famous insurance investor who took a small grubstake of around $50,000 and turned it into a massive family fortune of close to USD$900 Million dollars through investing in primarily insurance stocks. Davis called the combination of the first two factors (earnings and multiple expansion) the “Davis Double Play”.
He liked to use the example of being able to make 4 times his money when he bought a stock at a P/E of 10, and then it doubled its earnings over a period of years and the market revalued the business at a P/E of 20, thus creating a 4x return for Davis as an investor.
Yes! , Shelby Davis is one of the great investors that we seldom heard of or mentioned like Warren Buffett / Charlie Munger. Here, I am not trying to show you how he turned $50K to close to a Billion but the concept of " Davis Double Play ", particularly on investing during the market bubble.
If you look at the "Regression Chart" I often plot and show in my blog, there are two very important aspects of how to interpret the chart, to see how the indexes move in the long run.
As highlighted in "Davis Double Play", there are two important components that may affect the price of a company ie. EPS (growth) and PE ( expectation).
P/s= E/P x P/E
Similarly for the market, the Index (P) = EPS (market) X PE (expectations)
In the long run, the market should move along the Regression Line in line with economic growth ( Companies EPS increase) but in the mid and short term, the market also subjected to price /index fluctuation due to (sentiment ) mood ( Mr. Market) swing from optimism to pessimism from time to time.
This can be seen from the market PE level, sometimes it goes very high with max optimism, and sometimes it drops to very low with max pessimism. Market Index/price is not static and continues to move like a "flow" from point A to point B, depending on the "feedback loop" from investors as an aggregate, and very often it can deviate from "mean" to an extreme level like +/- 2 SD.
 |
| <ImageCredit:currentmarketvaluation.com> |
The P/E ratio is a classic measure of any security's value, indicating how many years of profits (at the current rate) it takes to recoup an investment in the stock. The current S&P500 10-year P/E Ratio is 31.9. This is 46% above the modern-era market average of 19.6, putting the current P/E 1.3 standard deviations above the modern-era average.
Since 2008/09, the Market (especially the US ) has been fueled by hot money from QE after QE and ultra-low interest rates which resulted in extreme and max optimism with high market PE. With recent interest increase and expected QT ( Quantitative Tightening ) from FED soon, the market will need to adjust the PE level to a more realistic level by "Mean Reversion ".
 |
| <Image Credit: CurrentMarketValuation.com> |
There is another way for the market to do the adjustment.
Remember the Davis Double Play :
P(Index) = EPS x PE
Yes, EPS !! this is what happens when share price ( and sometimes would drag the whole sector of the market ) like when Walmart or Target announced its financial result ( miss the target and poor earning guidance ), also for Tech companies like "Snap ".
Facebook parent Meta erases $53 billion in market value after Snap warning rips social media stocks<source: maket.buinessinsider.com>
The market will continue to adjust to EPS shock if the economic situation is getting worse together with expectations of rising interest rate ( due to higher inflation) and QT to be carried out by the FED from June onwards. It depends on how depressed Mr. Market will be and to compress the PE to a more reasonable level, till then, nobody knows when will be the bottom of the market.
How about STI or HSI?


Current PE is at around 11x vs 13x of the 20-year average.
HSI is considered cheap base on current valuation and if you do believe in "mean reversion" and "Davis Double Play ", the CHN/HKG situation may improve once they get away with "Zero-Covid" and increase in companies EPS once the economic situation returns to normal.
Quote Of The Day :
Shelby Davis: The time to make money is in a bear market <source: morningstar.in>
PS:
Fyi.. in 1969, Shelby Cullom Davis’s son, Shelby M.C. Davis, founded Davis Advisors after serving as the head of equity research at The Bank of New York in order to offer the Davis investment approach to outside clients.
Today, under the leadership of Christopher C. Davis, Davis Advisors is widely recognized as a premier investment manager serving individual and institutional investors worldwide.
One of the Flagship Fund:


Comments
Post a Comment