Asset Bubble : From Tulipmania to Bitcoin
 |
| <image credit: realinvestmentadvice.com> |
It could also be described as a situation in which asset prices appear to be based on implausible or inconsistent views about the future. Asset bubbles date back as far as the 1600s and are now widely regarded as a recurrent feature of modern economic history. Historically, the Dutch Golden Age's Tulipmania (in the mid-1630s) is often considered the first recorded economic bubble.” From Wikipedia.com
We may not know how the bubble form but we probably know how it ends.
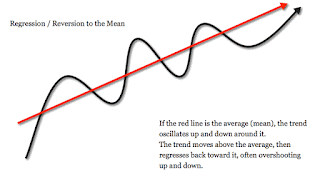
A picture is worth a thousand words :
 |
| image credit to Bloomberge.com |


 |
| image credit to Nikkie Inc |
 |
| image credit to Economist.com |
Five Steps of a Bubble (
From Investopedia.com
)
Minsky identified five stages in a typical credit cycle – displacement, boom, euphoria, profit-taking and panic. Although there are various interpretations of the cycle, the general pattern of bubble activity remains fairly consistent.
- Displacement:
A displacement occurs when investors get enamoured by a new
paradigms, such as an innovative new technology or interest
rates that are historically low. A classic example of displacement is the decline in the federal
funds rate from 6.5% in May 2000, to 1% in June 2003.
Over this three-year period, the interest
rate on 30-year fixed-rate
mortgages fell by 2.5 percentage points to a historic lows
of 5.21%, sowing the seeds for the housing bubble.
- Boom:
Prices rise slowly at first, following a displacement, but then gain momentum as more and more participants enter the market, setting the stage for the boom phase. During this phase, the asset in question attracts widespread media coverage. Fear of missing out on what could be an once-in-a-lifetime
opportunity spurs more speculation, drawing an increasing number of participants into the fold.
- Euphoria:
During this phase, caution is thrown to the wind, as asset prices skyrocket. The "greater fool" theory plays out everywhere.
Valuations
reach extreme levels during this phase. For example, at the peak of the
Japanese real estate bubble
in 1989, land in Tokyo sold for as much as $139,000 per square foot, or more
than 350-times the value of Manhattan property. After the bubble burst, real
estate lost approximately 80% of its inflated value, while stock prices
declined by 70%. Similarly, at the height of the internet bubble in
March 2000, the combined value of all technology stocks on the Nasdaq was higher
than the GDP of
most nations.
During
the euphoric phase, new valuation measures and metrics are
touted to justify the relentless rise in asset prices.
- Profit Taking:
By this time, the smart money –
heeding the warning signs – is generally selling out positions and taking
profits. But estimating the exact time when a bubble is due to collapse
can be a difficult exercise and extremely hazardous to one's financial
health, because, as John
Maynard Keynes put it, "the markets can stay
irrational longer than you can stay solvent."
Note
that it only takes a relatively minor event to prick a bubble, but once it is
pricked, the bubble cannot "inflate" again. In August 2007, for
example, French bank BNP Paribas halted withdrawals from three investment funds with
substantial exposure to U.S. subprime
mortgages because it could not value their holdings.
While this development initially rattled financially
markets, it was brushed aside over the next couple months, as
global equity markets reached
new highs. In retrospect, this relatively minor event was indeed a warning sign
of the turbulent times to come.
- Panic:
In the panic stage, asset prices reverse course and descend as rapidly as they had ascended. Investors and speculators,
faced with margin calls and plunging values of their holdings, now want to liquidate them at any price. As supply overwhelms demand, asset prices slide sharply.
One
of the most vivid examples of global panic in financial markets occurred in
October 2008, weeks after Lehman Brothers declared
bankruptcy and Fannie Mae,
Freddie Mac and AIG almost collapsed. The S&P 500 plunged almost 17% that
month, its ninth-worst monthly performance. In that single month, global equity markets lost a
staggering $9.3 trillion of 22% of their combined market
capitalization.
Cheap Money ( near-zero interest rate after GFC )
“Household liabilities almost doubled from
$160.5 billion at the end of 2006 to $309.2 billion 10 years later. Most of
this increase was because of mortgage loans, which jumped more than 95 per cent
to $233.1 billion over that period.
Thanks to eight rounds of property cooling measures, and especially the imposition of the total
debt servicing ratio (TDSR), which capped the total debt obligations of households
at 60 per cent of income, the growth in household debt started to taper off
after 2013 - it rose only about 16 per cent between 2014 and June this year.
But the fact remains that Singapore households are much more leveraged now than
before the Great Recession - although the value of their assets, including
their property assets have also gone up.” Quoted from www.straitstimes.com
How do we know when
irrational exuberance has unduly escalated any asset values
Cheers !
Quote Of The Day :
Robert Shiller, “Speculative bubbles do not end like a short story, novel,
or play. There is no final denouement that brings all the strands of a
narrative into an impressive final conclusion. In the real world, we never know
when the story is over.”


Comments
Post a Comment