My Investment Strategy : 3 Ts 3 Ms ( part 2)
Before I start to explain the 3rd and 4th
elements, allow me to quote below from Warren Buffet which is very much related
today’s blog post :
"The
Intelligent Investor has three big
lessons: think of a stock as a part
ownership of a business; the market
is there to serve you, not instruct you; and always require a margin of safety. Berkshire
shareholders are better than most at understanding that they own a part of a
business.
In
most of the case, the best advice is the one which is simple to digest, a few
choice of words can summarize winning strategies and rules of thumb quite
nicely. Below are two of the most insightful and useful concise quotes about thinking
investing as business-like from Peter Lynn.
“Behind every stock is a company. Find out what it's doing.”
“If
you don’t study any companies, you have the same success buying stocks as you
do in a poker game if you bet without looking at your cards.”

Would like to clarify that the meaning of “trade” here is not referring to “day trader “, who trade stocks on a daily basis to make a quick buck.
Trade here means buying stock as buying a property or business for long term
investment.

As above quoted, we should always think that buying stock is buying
“part of a business”, but a notable
change of “behaviour “ when we buy
share vs other asset class. After pressing the buy button, we tend to continue
checking the price movement of the stocks and hope it may increase soon.
Such behaviour is a huge contradict
to our behaviour when we make a purchase on a property or setting up a business.
We don’t check our property price on a daily basis or requesting a quotation on our
business valuation from time to time, but why this happens on share purchase?
One of the possible explanation is the “ Liquidity “, advantage of the market is it provide us with the ”liquidity
“ but it also gave us an excuse to "trade" as buying and selling stocks is so easy within seconds.
Valuation of stocks and business.
Trading or buying of any stocks should base on “valuation “, but how
to value a stock?
For me, a successful investor must know the way to analyst a stock
(business). Knowing some basic understanding of fundamental analysis (F.A) by
using a various financial ratio like PE, PB, Debt / Equity, Dividend Yield etc. Also, some basic
understanding of technical analysis (T.A) to judge the trend and momentum of
the targeted stock.
Many good articles about these 2 schools of thoughts on stock analysis
been written and one can easily get such info from the internet , hence I will not
elaborate more here.
Fundamental Analysis:http://www.investopedia.com/university/fundamentalanalysis/
Technical Analysis :
Is Stock valuation an Art or Science?
Knowing
what an asset is worth and what determines that value is a pre-requisite for
intelligent decision making -- in choosing investments for a portfolio, in
deciding on the appropriate price to pay or receive in a takeover and in making
investment, financing and dividend choices when running a business.
The premise
of valuation is that we can make reasonable estimates of value for most assets,
and that the same fundamental principles determine the values of all types of
assets, real as well as financial. Some assets are easier to value than others,
the details of valuation vary from asset to asset, and the uncertainty
associated with value estimates is different for different assets, but the core
principles remain the same.
 Prof Aswath Damodaran try to explain more about
valuation in this little book :
Prof Aswath Damodaran try to explain more about
valuation in this little book :
Allow me to quote from the book :
“You buy financial assets for the cash flows you expect to gain. The
price of a stock cannot be justified by assuming there will be other
investors around who will pay a higher price in the future. That is equivalent
to playing an expensive game of musical
chairs .”
Further Reading on stock valuation from Wikipedia: Model like DCF (
Discounted cash flow ) or Earning Multiplier etc..
No matter how scientific way we use to value stocks, there will be a challenging part of putting or
estimating the “ growth figure “ and “
discounted rate “ to be used.
A Minor change of these
figures might give a very Big different
on the end result of the valuation. That’s is the reason why we always see
such huge different on so call “ target price “ set by each brokerage firm on
same stock.
That’s why I think stock valuation is a combination of science and art.
1 1) Science by using ratio analysis on PEG/ROE/Debts to Equity / Dividend
yield /PBVetc.
But beware of the valuation trap
and don’t just look at the figure but need to do a more in-depth analysis on
things behind the figures, like why the PE is low ? ( could it be because profit
dropped and hence price dropped), High dividend? ( is the dividend
sustainable with support from free cash flow ), Low PBV? ( was it a real asset?
or just goodwill ) .. etc.
 |
| image credit to js.qinxue100.com |
2) Art by using “regression line” when stock price drop to below mean value.
Note: One needs to be extra careful in using the regression line
for individual stock as the price dropped might due to the fundamental change of the
underlying stock e.g Noble Group/ Semcorp Marine. Also, need to take note that
“regression to mean” may take much longer time after the correction, depending
on market sentiment and fundamental of the stocks.
Regression is just a pure “ statistical
phenomena “, one will still need to use the “fundamental analysis “ to
judge the value of the underlying stocks.
## Disclaimer: Stocks or charts shown below are just for
illustration purpose, Please read the disclaimer note at the end of this blog
post and DYODD if you want to use
any of this information.
Regression Chart of 3
Banks: It seems that the bank’s stocks are having pressure on debts allowance from
O&G sector as well as the poor economic performance of China.
Below just to show the regression line of 3 banks account, it seems that
OCBC is deviating from the regression more than the other 2. Of course, it does not
mean it is better to buy , one would need to look at the fundamental factors on
these banks as well.


Example of 3 more counters which deviated more from Regression Line :
<GLP: Price decreased may be due to China’s factor >

< HKG Land: Price decreased may be due to cooling measure and lacklustre of
property sectors >

<ARA: Price decreased may be due to the right issue and their prospect of future growth>

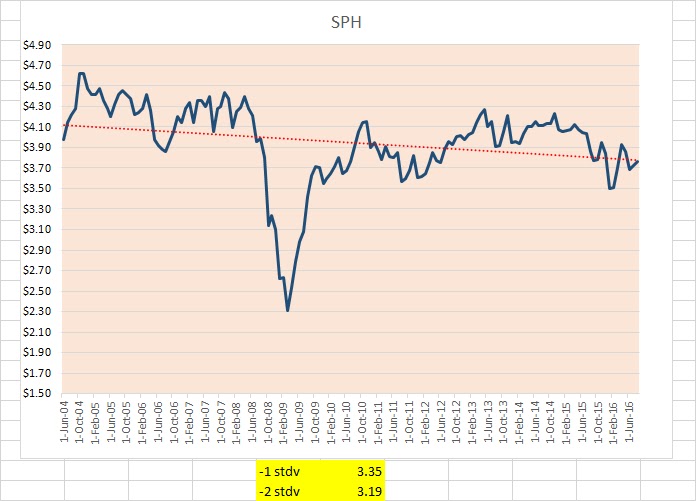
2 more Charts to show the stocks
which might have deviated above the regression line, hence may reflect the investor’s high “expectation “ on their future growth.
But remember quotes from another Great Investor, Andre Kostolany: "Never run after a bus or a stock. Just be patient - the next one
will come along for sure."


< Some stocks will just move in sideways for a long period of time,,,
investors may opt for their dividend instead: SPH >
I am a " Free Rider ".
I am not good at analysing a company with the figure but there is no lack of good bloggers
surrounding us that giving a very good analysis on stocks or industries. Allow me
to highlight a few of them :
Further reading :
The
ThumbTack investor | CONTRARIAN, DEEP VALUE INVESTING IDEAS

According to Benjamin Graham, Mr Market (stock market ) is a hypothetical investor who is driven by panic, euphoria and apathy (on any given
day), and approaches his investing as a reaction to his mood, rather than
through fundamental (or technical) analysis.
“The stock market is the story of cycles and of the human behaviour that is responsible for overreactions in both directions.” By Seth Klarman
One of the financial world’s greatest debate is whether the market is efficient .that is, whether price reflects all available information
and thus represent the asset’s fair value.
2 schools of thoughts on market efficiency, one belongs to
Eugene Fama ( who won the Nobel Memorial Prize in Economic Science in 2013 )et
al a strong believer that the market is fully efficient. Another camp that opposed
market efficiency came from Behaviorist Economist like Robert Shiller, Daniel
Kahneman ( another Nobel Memorial Price winner in 2002 ) et al.
According to Wikipedia, Behavioral
economists attribute
the imperfections in financial markets to a combination of cognitive biases such as overconfidence, overreaction, representative bias, information
bias, and various other predictable human errors in
reasoning and information processing.
Speculative economic bubbles are an obvious anomaly, in that the market
often appears to be driven by buyers operating on escalating market sentiment/ irrational
exuberance, who take little notice of
underlying value. These bubbles are typically followed by an overreaction of
frantic selling, allowing shrewd investors to buy stocks at bargain prices.
Rational investors have difficulty profiting by shorting irrational bubbles because in the words of a famous saying attributed to John Maynard
Keynes, "Markets can stay
irrational longer than you can stay solvent. Sudden
market crashes as happened on Black Monday in
1987 are mysterious from the perspective of
efficient markets, but allowed as a rare statistical event under the weak-form
of EMH ( Efficient Market Hypothesis ).
 |
| image credit to weibo.com |
For me, the market is in fact
efficiently inefficient, mean “ a bit of both “ .. haha . in Confucius we
called it “ 中庸之道“
.. taking a middle or mean course.
I believe that because of “
creative destruction “, some company may disappear due to technological change
, lack of innovation or diminishing product value, but the market as a whole will remain
and any downward during crisis tend to revert to mean in the long run.
You may refer to my “trade” a strategy that I tend to take more buy position when the market crash and correct to
below mean value and waiting for the market to “reverting to mean “.
If there is no such
opportunities occur, I will just wait patiently and accumulating more cash as
what I’m doing now. I may keep the dividend for a few quarters while waiting for
the opportunities as we know that sometimes market could just moving sideways for a very long period of time.
I may also temporary park my
money (war-chest ) in short term bond although the yield is much lower than
stocks I am holding.
We must remember that "market " always move in a cycle ...like four seasons, sometimes we will have long and harsh winter and sometimes we will enjoy best springs.
Keeping our emotions in check is a key trait for a successful investor!
 |
| image credit to munKNEE.com |
When Butterfly meets the Swan.
The market could be in very depressed or over-pessimistic
situations if any “black swan “ event
happens and things may get worse due to “ butterfly
effect “. If that happens, it may reflect the utmost “irrationality “ of
the market and pose for rare opportunities if one knows how to take advantage of
it, of course with a little bit “ margin of safety” on stocks selection.
Concept
explained: Black Swan
 |
| image credit to liveindex.org |
Concept
explained: Butterfly Effect
The butterfly effect is the concept that small causes can
have large effects. Initially, it was used with weather prediction but later
the term became a metaphor used in and out of science.
In chaos theory, the butterfly effect is the sensitive dependence on initial conditions in which a small change in one state
of a deterministic nonlinear system can result in large differences in a
later state.
The name, coined by Edward Lorenz for the effect which had been known
long before, is derived from the metaphorical example of the details of a
hurricane (exact time of formation, exact path is taken) being influenced by minor
perturbations such as the flapping of the wings of a distant butterfly several
weeks earlier.
 |
| image credit to en.wikipedia.com |
There's more than one way to skin a cat and All Roads Lead to Rome !!
Everyone may have their own methods to invest in stock market :
 |
| image credit to BBC.com |
Cheers!


Hi STE
ReplyDeleteThank you much for the kind mention.
I have a question on the regression line. Do you generally tend to sell when it has regressed to the mean or at least wait until it gets above say 1 sd above the mean? I'm particularly looking at the hk land chart and banks and for hk land it gives a mean of $7 :)
Hi B,
DeleteIt depends on individual on when to sell, for punter to make quick buck, they may sell at regression line to make some profit, but for me, I will try to hold much longer at wait for price above regression line..say close to +1stdv. .which is around $9.unless there is sudden change on company's fundamental .else, I may just " sit tight " as great speculator Jesse Livermore said. .and collecting the dividend. . Cheers :)
Thanks. It makes sense especially if the company yields good dividend yield, I'd do the same thing too. But just rethinking the strategy on HK Land because the yield is a lot lower than other dividend paying companies :)
DeleteYah! You are absolutely right,for Hkg Land. .basic we are buying $1 worth stuff for 50 cetns. ..so the dividend may not be the attractive point. .just hope that the property market may turn quickly. .
DeleteCheers! :)
STE,
ReplyDeleteWow!
Writing your magnus opus?
Combine East and West philosophies ;)
Hi SMOL!
DeleteNo lah! Just write east write West (写东写西)..to kill times. .
Sometime, like old man, keep repeating what we say ..:)
Cheers!
Hi STE,
ReplyDeleteThanks for the part 2. Very insightful.
Do you concentrate your investment in SG stocks and blue chip only?
Hi Ray,
DeleteThanks for the comments and glad to know that you like the post...
I'm basically just invest in SG market but not just confine to blue chips,, I have a very diversify portfolio with mainly income generating stocks,, as I m just depending on my dividend incomes to survive ,, I need to be extra " kia-su and Kia-si" ...hence I can't really hv concentrate portfolio like young and aggressive investors!
I shall review my portfolio in future blog post ! Stay tuned !
Cheers ! :)
Hi STE,
ReplyDeleteThe numbers part is also an Art, IMHO.
Have u noticed when a company get "privatized" many "experts" will try to guess the next one, and they will quote many factors like discount to NAV, shareholders' profile etc.
I realize that the buyers, more often than not, to do use the matrix we use, instead they look into the future and how that buy can strategically add value to their existing business.
NOL and SMRT, in terms of number, does it make sense to buy them? There are many reasons quoted and the final destination is always bottom line but hardly "current valuation" is the reason.
Look at Singpost acquisition and Alibaba acquisitions, all of them loss making ventures
Hi SI,
DeleteThanks for the comments. .yah, I did notice that many opinions on next target of privatisation, but I do think such forecasts is difficult and expected gain of each deal also subjective as u mentioned. .I think we would be better to look at companies underlying biz and future growth instead .
Cheers! !
how do you create this regression line, is there a blog post talking about this?
ReplyDeleteHi Bruce,
DeleteI don't have blog specifically talking about how to plot this ..but just FYI...thus can be done easily by using excel , get the price or index data from Yahoo finance then plot a line chart by using excel...after that right click on the line to add the regression line...
But for the deviation line , would hv to draw it manually.
Use the excel formula to get the +/- stdv pojnt from the data ...then calculate thd deviation point and plit the line accordingly..
Hope this clarify...Cheers 👍👍