Portfolio & Dividend Update : 3rd Qtr 2023
Higher For Longer
The Federal Reserve held interest rates steady in the
recent FOMC meeting, while also indicating it still expects one more hike
before the end of the year and fewer cuts than previously indicated next year.
In addition to holding rates at relatively high levels, the Fed is continuing
to reduce its bond holdings through the so-called QT, a process that has cut the
central bank balance sheet by some $815 billion since June
2022. The Fed is allowing up to $95
billion in proceeds from maturing bonds to roll off each month, rather than
reinvesting them.

The “dot plot” chart from the latest FOMC meeting showed a much
higher and longer rate till 2026 and this has “spooked” the market, causing
some reactions and pulling down of market indexes last week.
“Chair Powell and the Fed sent an unambiguously hawkish
higher-for-longer message at today’s FOMC meeting,” wrote Citigroup economist
Andrew Hollenhorst. “The Fed is projecting inflation to steadily cool, while
the labor market remains historically tight. But, in our view, a sustained
imbalance in the labor market is more likely to keep inflation ‘stuck’ above
target.”
Along with the rate projections, members also sharply
revised their economic growth expectations for this year, with gross
domestic product now expected to increase by 2.1% this year. That was more than
double the June estimate and indicative that members do not anticipate a
recession anytime soon. The 2024 GDP outlook moved up to 1.5%, from 1.1%.
You may find the “minutes “of
the FOMC on 20 September meeting here
The most serious issue here is the moving of long-term bonds
like 5/ 10 / 20 years bond yield which will have more impact on the business and economy more than the movement of short-term rates.
Why Do Bond Yields Keep Rising?
‘Higher
for longer’ is Wall Street’s newest catchphrase.
On Thursday, the U.S. Treasury 10-year note hit a new recent
high of 4.49%—up from 4.09% at the end of August and 3.79% at the start of 2023. Not only that, but bond market pros are now saying that these
higher rates could persist for some time. The hottest phrase in the markets has
been “Higher for longer” since the Federal Reserve’s policy-making meeting last
week.
Several issues have been
driving bond yields higher over the last two months. Most
prominent is the continued strength of the U.S. economy, especially the jobs market,
which is seen as the reason the Fed will keep interest rates at or near current
levels for longer than what had been expected. In addition, the market is
adjusting to a flood of new government bond issuance.

With the recent rising oil price, I think the FED will be more hawkish
(cautious) and must watch the inflation data closely so that it would have to hold
the rate for much longer and higher for the time being.
Atlanta FED GDP Now is forecasting a very strong 3rd
Qtr GDP which is also a concern for FED where the economy might still be too “hot “,
together with possible and continuous worker union strikes in demand for
higher “wages”, all these may cause the inflation to rear its ugly head again.
GDPNow <link source :Atlantafed.org>
This
Time Is Different

Almost every time we have an “inverted yield” curve, it is followed
by an economic recession, but this time round, even with a much deeper and
longer “inverted yield curve”, we have yet to see a recession. From the above data from the GDPNow forecast, GDP
seems very strong with no signs of “recession “
The yield curve could still steepen further and
remain inverted for some time. Fed officials’ median forecast after their
latest meeting suggested another half a percentage point of interest-rate
increases this year, which could lift short-term Treasury yields even further.
Meanwhile, several factors are keeping yields low for longer-dated debt.
“The long end of the curve is being held down
relative to inflation due to excess liquidity
in the markets and the high risk of secular global deflation
resurfacing,” wrote Steven Ricchiuto, U.S. chief economist at Mizuho Securities
USA.
Trillions of $$ have been created by world central banks during the Covid-19
pandemic, and almost a 4.5 trillion increase in FED balance during that period,
although the FED has been doing the QT recently by almost 1 Trillion, but still there
is around 3.5 trillion excess liquidity flooding the market and moving here and
there.

Although we have seen the huge excess liquidity piling up in FED
RRP accounts or Commercial Bank balance sheets, from the consumer end, we have started
to see some signs of a “credit crunch” and banks become more cautious in credit
expansion.

“Bank credit is in negative YoY 2nd time since the 1970s”
“More Americans are falling behind on their car loan and credit card
payments than at any time in more than a decade, a troubling signal of consumer
stress as higher prices and rising borrowing costs are squeezing household
budgets. The pain is most acute for lower-income earners, who have largely used
whatever they managed to save during the pandemic with the help of government
stimulus checks and breaks on obligations such as rent and student
loans.
“The increase in delinquencies and defaults is symptomatic of the tough
decisions that these households are having to make right now — whether to pay
their credit card bills, their rent or buy groceries,” said Mark Zandi, chief
economist at Moody’s Analytics.
Households
spent more and saved less <link source: frbsf.org>
In a study earlier this year (Abdelrahman and
Oliveira 2023), we examined household saving patterns since the
onset of the pandemic recession. Our study showed that households rapidly
accumulated unprecedented levels of excess savings—defined as the difference
between actual savings and the pre-recession trend—relative to previous
recessions. Our analysis suggested that some $500 billion of the $2.1 trillion
in total accumulated excess savings remained in the aggregate economy by March
2023.
Since then, data revisions show noticeable changes in household
disposable income and consumption, while new data releases indicate that
consumer spending picked up in the second quarter. Our updated estimates
suggest that households held less than $190 billion of aggregate excess savings
by June. There is considerable uncertainty in the outlook, but we estimate that
these excess savings are likely to be depleted during the third quarter of
2023.
The Bureau of Economic Analysis recently revised its
previous estimates to show household disposable income was lower and personal
consumption was higher than previously reported for the fourth quarter of 2022
and the first quarter of 2023. The combined revisions brought down the Bureau’s
measure of aggregate personal savings by more than $50 billion. In addition,
second-quarter data indicate that household spending continued to grow at a
solid pace.
Figure 1 shows that estimates of accumulated excess savings, in nominal terms, totaled around $2.1 trillion by August 2021 when it peaked (green area). Since then, aggregate personal savings have dipped below the pre-pandemic trend, signaling an overall drawdown of pandemic-related excess savings. The drawdown on household savings was initially slow but started to accelerate in 2022 and has remained around $100 billion per month on average

Figure 1: Aggregate personal
savings versus the pre-pandemic trend

The US Treasury Dept issued almost $1 trillion of debts since the “debt
ceiling” cap was lifted by Congress, without any problems or pushing up the
interest rate as this is almost all (80%) came from RRP balance and some from the bank’s balance sheet. There is still $1.4 trillion of excess liquidity that can
be used. If the federal gov keeps
spending at the current rate, RRP will be empty by June/July 2024, at that time
what will happen after this excess liquidity is dried up?
This
incredible chart shows the close relationship between the S&P 500 and Fed
liquidity <link
source:marketwatch.com>

No doubt, the S&P 500 is
still one of the best-performing indexes (other than Nasdaq100) as compared to
others, it is up +12,5% (as of 23rd Sep), but with the drying up of
excess liquidity and saving, plus the tightening of credit from banks, will
S&P 500 Continue to outperform the world indexes in next few years down the
road ? or maybe This Time Is Different !!
The S&P 500 is not as
diversified as you think ….
The 10 largest companies in the S&P 500 now make up 34% of the index
with an average P/E ratio of 50x. This is the highest percentage since 2001
during the Dot-com bubble. Even in the 2008 bubble, this percentage peaked at
~26%. These same 10 companies have accounted for ~80% of the Nasdaq's entire
rally this year. Markets are increasingly held up by a few stocks, particularly
in the technology sector.

“The magnificent 7
in S&P 500 up >50% in 2023, the remaining 493
stocks basically flat, Apollo's Slok has calculated. The bottom line is that if
you buy the S&P 500 today, you are basically buying a handful of comps that
make up 34% of the index and have an average P/E ratio of ~50.”

Factors & the Magnificent Seven <link source:blackrock.com>
Today, the Magnificent Seven make up 28% of the S&P 500 Index and have contributed almost 65% of the S&P 500 Index YTD returns. The combined weight of these companies is greater than any combined weight of the top seven companies in the S&P 500 Index since before the turn of the 21st century.
Another
way to measure market valuation (other than PE/PB or PS) is by looking at the
level of FCF Yield on each company, and whether they have enough cash
to compensate shareholders, be it through share buyback or dividends after
spending on CAPEX.


Why Diversification Matters
It seems that investing only in the
S&P 500 does not provide one with the broad diversification that would
minimize or mitigate the unsystematic risk. Also, the past performance of the
S&P 500 is not a guarantee of future performance. The liquidity-driven
performance for the past decades may not happen again in the next decade.
Without a doubt, the past decade was a sensational run for investors, with the S&P 500
registering a total return of 178%, or 11.9%
annually since 2009.
For obvious reasons, investing in the S&P 500 seems like a “no-brainer” to many investors. However, this strategy
(only investing in the S&P 500) is not bulletproof and is not a wise
strategy for long-term investors because it ignores/deviates from some
fundamental principles of diversification and the historical unpredictability of the market.
More importantly, just because the
S&P 500 has delivered phenomenal returns in the past, doesn’t mean that you
should only invest in this asset.
Even those who have already benefited from the past 10-year
returns could fall into the trap of creating unrealistic expectations about
what the future might hold.
Well, you may continue to enjoy the party before the music stops
and when that happens, we may suddenly realize that the S&P 500 is the most dangerous Index.
By then…maybe FED will pivot, reverse the course,
begin cutting interest rates, and start the QE again.
What
could happen if the government shuts down <link
source:cnn.com>
I am not so worried about the “government shuts down”
which is mostly “wayang”, but
more concerned with below:
THE
NATIONAL DEBT IS NOW MORE THAN $33 TRILLION. WHAT DOES THAT MEAN? < link source: pgpf.org>

Wait! Why worry? is OK,
T.I.N.A., we can basically
keep printing $$ as long as the world needs it.
The total US national debt spiked by $1.58 trillion
since the debt ceiling was lifted, and by $2.16 trillion from a year ago, to
$33.04 trillion, according to the Treasury Department’s figures on 18th
September 2023.
A stunning amount of new debt is piled on in a stunningly short
amount of time, even as the economy has been growing at decent rates!
Congratulations, America 😊Cheers!
The Power of Dollar’s Supremacy!


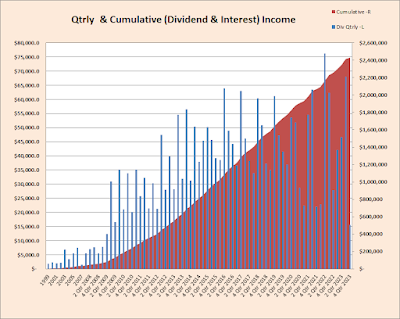


Portfolio Returns: YTD XIRR = +3.7%


“China’s property crisis is far
from over and that’s going to be an overhang on stocks,” said Wang Zheng, chief
investment officer at Jingxi Investment Management in Shanghai. “The property
market is crucial to China’s economy, given its size and weighting. No other
industry can replace it as a stabilizer of the economy any time soon.”
All in all, my portfolio has been like a " cruise to nowhere" since 2019 ... 😓
Till next update ! Cheers !!


Thanks. Good analysis with data to backup.
ReplyDeleteI concur with your points except the near total exclusion of NYSE/SP500 shares may be unwarranted. Some of those tech or growth stocks in Nasdaq/Russell2000 could have outsized gains in the future regardless of the issues of the US economy and debt.
Thanks for the comments 🙏 Yes, you are right, not totally exclude but more on diversification other than S&P500. Also you rightly pointed out that most of the S&P500 or major tech companies also have substantial revenue came from countries outside USA , hence the US economy n debts may not have much impact. It boils down to the overall ability to generate meaningful cash flow to support the high PE. Cheers!
DeleteHi brother
ReplyDeleteThanks for the article amd sharing your thoughts. It came a few days earlier.
For the view of no recession, I have my reservation. US economy is big and complex. The data keep getting revise, includingthr GDP. Fed had got it wrong during the GFC. It was a year later that Americans realized that they already had a recession. Lol. I was working in the US when Lehman collapsed. Just 2 weeks after I landed on US soil. A first glimpse of how complicated things can be in the US. 😉 only in hindsight we realised what the heck was going on back then.
Hi Bro,
DeleteThanks for the comments and your insight about US economy. Yup, I fully agree with you on US current economy situation, especially from consumption and consumers spending's perspective which show signs of weakness ,an increase of car loan n credit card deliquescent %. Things may get worse when banks starts to tighten the credit. At this moment, everyone seems happy with most of the analyst projection of so-called " soft landing". Of course we do know what will happen can't predict the future, and let's hope it works ad what happens in US might have impact on us and world economy s well.🤞😊
I have just started this journey 3 years ago right after Covid happened that made me realised I need to have cash flow in life and not rely on work purely.
ReplyDeleteHi Billy, indeed ,having continuous cash flow is important ( as our human capital or active income have limit) and dividend investing is good that it provides me good cash flow although the portfolio value is up n down from time to time but as long as you are investing in good companies with strong fundamental, we should ignore the short term portfolio value fluctuation.👌
Delete