The Psychological Impact Of Maximum Drawdown (MDD) on Portfolio Management
I suppose everyone is still in the holiday mood after celebrating Christmas with our loved one and about to countdown the arrival of 2022, a new chapter or year in our journey of investment and I will try to keep this blog post short. There is one very important topic I would like to highlight here before the closing of 2021, i.e “ The Psychological Impact Of Maximum Drawdown (MDD) on Portfolio Management."
For every investor, I think drawdown should be one of the
most important topics to understand when you start to learn about stock
investing. Even before talking about gains or returns you expect from your
investment, one should really and clearly think about “how much I can stand or “tahan”
to lose from the investment? what are my risk tolerance and maximum drawdown I
could stand when looking at my portfolio in RED, especially the psychological
impact of losing sleep or stress?
What Is a Drawdown? <Source: Investopedia.com>
KEY TAKEAWAYS
- A drawdown refers to how much an investment or trading account is down from the peak before it recovers back to the peak.
- Drawdowns are typically quoted as a percentage, but dollar terms may also be used if applicable for a specific trader.
- Drawdowns are a measure of downside volatility.
- The time it takes to recover a drawdown should also be considered when assessing drawdowns.
- A drawdown and loss aren't necessarily the same thing. Most traders view a drawdown as a peak-to-trough metric, while losses typically refer to the purchase price relative to the current or exit price.
What Is a Drawdown?
A drawdown is a peak-to-trough decline during a specific period for an investment, trading account, or fund. A drawdown is usually quoted as the percentage between the peak and the subsequent trough. If a trading account has $10,000 in it, and the funds drop to $9,000 before moving back above $10,000, then the trading account witnessed a 10% drawdown.
The Drawdown Explained
A drawdown remains in effect as long as the price remains below the peak. In the example above, we don't know the drawdown is only 10% until the account moves back above $10,000. Once the account moves back above $10,000, then the drawdown is recorded.
This method of recording drawdowns is useful because a trough can't be measured until a new peak occurs. As long as the price or value remains below the old peak, a lower trough could occur, which would increase the drawdown amount.
Drawdowns help determine an investment's financial risk. The Sterling ratios use drawdowns to compare a security's possible reward to its risk.
A drawdown is the negative half of the standard deviation in relation to a stock’s price. A drawdown from a share price’s high to its low is considered its drawdown amount. If a stock drops from $100 to $50 and then rallies back to $100.01 or above, then the drawdown was $50 or 50% from the peak.
I think many of those invested in HK/CHN Tech stocks like Alibaba/Tencent/Meituan (ATM) really spooked and caught off guard by the magnitude of YTD price correction for these stocks from the high till now, continuously dropping day by day and week by week, some to around -40 to -70% from its all-time highs.
I am not sure how many have already cut-loss and jumped-ship due to this round of correction after the crackdown on anti-monopoly or data-securities issues from the government, and worse still the uncertain rise due to so-called " common prosperity " policy and how it affects the company's future earnings growth and trajectory.
Recent Market Volatility <Source: CenterWealth.com>
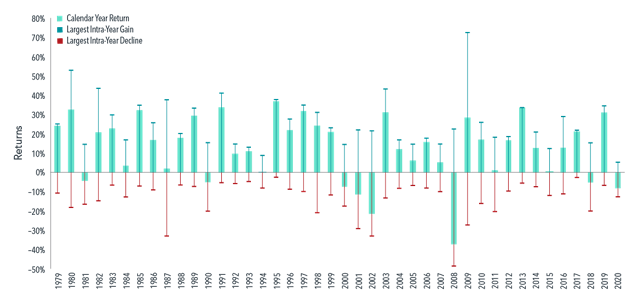
In US dollars. Data is calculated off rounded daily returns. US Market is measured by the Russell 3000 Index. Largest Intra-Year Gain refers to the largest market increase from trough to peak during the year. The largest Intra-Year Decline refers to the largest market decrease from peak to trough during the year. 2020 is year-to-date as of February 28, 2020. Frank Russell Company is the source and owner of the trademarks, services marks, and copyrights related to Russell indexes.
Exhibit 1 shows calendar year returns for the US stock market since 1979, as well as the largest intra-year declines that occurred during a given year. During this period, the average intra-year decline was about 14%. About half of the years observed had declines of more than 10%, and around a third had declines of more than 15%. Despite substantial intra-year drops, calendar year returns were positive in 34 years out of the 41 examined. This goes to show just how common market declines are and how difficult it is to say whether a large intra-year decline will result in negative returns over the entire year.
Just look at the above chart, even at the market level, we can see that the intra-year swing of the market could be huge and at any year it could be as high as -20% to -30%, such intra-year swing is quite common. This, we are talking about the overall "market", for individual stock, I am sure the swing will be much higher, especially the so-called high growth/tech stocks.
Imagine if you have a very concentrated portfolio with just a few HKG/CHN Tech stocks in your portfolio, I am sure the psychological impact and stress will be tremendous by looking at your stocks mostly down by -40 to -70%.
You can see that even Hang Seng Tech Index 3067 had a max drawdown of -50.4% from peak-trough and some like Alibaba is worse. OK, for me, no exception, I am doing as bad as the market, my max-drawdown is bout -39% for the tech stocks in my portfolio ( total Tech is around 12.3% in my portfolio). I am sitting with a paper loss of more than -$100K as of now but I am ok to have the patience to wait and ride through this turbulence. I don't have a crystal ball to tell how and when it will recover or it may not recover at the end of the day, but you should know this is the risk you would face in investing in these tech stocks, from day one you pressed the "BUY" button.

Will this crisis turn out to be an opportunity this time around? I really don't know, but again, make sure you do understand your "risk tolerance " and have a diversified portfolio if you want to venture into the HKG market.
Will more loose monetary policy in China help to add some stimulus to some of the sectors which are still struggling like property and techs?
Diverging monetary policies in US, China may provide some balance to global economy <source: straitstimes.com>
Well, we are seeing some good news or data on Covid-19 from South Africa and UK in regards to Omicron, do hope that this Omicron will be the last VOC ( Variant Of Concern). I am still positive on this and fingers crossed.
Taking this opportunity, I would like to wish all :
" A very Happy and Prosperous (Huat) Year 2022 !!

Till next update!
Cheers!
STE
PS:
Further Reading:
A good write up from Kyith (InvestmentMoats.com) :
How to Manage Your Fear of Loss and the Maximum Stock Exposure You can Tolerate to Remain Invested Longer
Diverging monetary policies in US, China may provide some balance to global economy <source: straitstimes.com>


hI STE,
ReplyDeleteHappy early new year to u. I think this is really a timely and good reminder for me. Recently, I did feel the pinch as the HK market is in correction mode. And I did own Alibaba and JD too.
We are still in the middle of a bull market, and if we feel like throwing in the towel, imagine ...when there is a correction
Hi SI,
DeleteThanks for well wishes , hope we all will have a "huat" and great year in 2022! :D
Yup, I think the magnitude of the swing on CHN Tech stocks is really unexpected and caught us ( most of the investors) off guard , hope things ( with China central bank having a loose and expansionary monetary policy) will be better next year ! :D
Cheers !
Good reminder. I have baba and -48%. Fortunately is like 1% of my portfolio. Nevertheless a lesson.
ReplyDeleteHi Cory,
DeleteThanks for the comments and yes, BABA is one of my worst performance stock in my portfolio, Yup , position sizing is important (lucky that you have only 1% exposure in your portfolio). Having a diversified portfolio is important although we couldn't capture the max returns on some of the stellar performance of few exceptional strong growth stocks.
Wishing you A Happy & "Huat" Year 2022 ! :D
Cheers!