Volatile Market: A New Normal
World stock market continued it strings of volatile trading sessions recently when 10 Years Treasury Notes hitting 1.5%, a sign that FED is going to increase interest rate in near term due to higher “inflation expectation “post pandemic as economic is going to restore back to Pre-covid 19 level.
 |
| <Image credit :GuruFocus.com> |
Why
the 10-Year U.S. Treasury Yield Matters < source: Investopedia.com>
Market still flooded with liquidity and the short-term rate of
1-3 years which usually mean to determine the corporate loan / bond remain low
and below 1 % level. FED already reiterate that the interest rate will remain “accommodative
“in view of weak employment data and challenging economic situation even after
reopening of economy and may take time to recover. FED may shift their goalposts on inflation expectation or targeting goal as they mentioned recently about more “holistic”
approach by looking at employment and economic data in deciding when to
increase FED rate, which I think is quite “subjective and creative “at this
moment.
A more dangerous signs to look out will be when is FED going
to start “deleverage “their balance sheet. For time being, even after pulling
out money from long term bond market, money will still be moving around. With
additional trillions of stimulus package anticipated to be approve soon,
investors / institution will still need to find place to park these $$$. Soon,
there will be another bubble pop-up somewhere even after one burst with such
huge liquidity circulating within the economy.
I think market just try to find excuses to sell after having
such good run in 2020, especially those tech or growth stocks with lofty valuation.
A pull back of -10% to -20% will be normal when you have more than 45% increased
as compared to pre-covid level while economy still struggle to recover now.
Some of the so-called tech / growth stocks will be hit harder than others during
this pull-back since it has gone up as much as 100-200% in 2020.
Is
Inflation an issue or concern in near future?
Yes, there will be an inflation after so much of money being
“printed “globally, as Milton Friedman
famously said, “Inflation is always and everywhere a monetary phenomenon in the sense that it is and can be produced
only by a more rapid increase in the quantity of money than in output.”
I think the biggest “risk “now is to let our money sitting
in the bank and do nothing… investing and building a more diversify portfolio
across different sectors might be the answer to “beat “the inflation in the
long run.
Of course, depending on your risk tolerance to allocate how
much money to be invested in Bond or Equity, even toping up your CPF SA account
might be a good option.
Any dip or correction of 10-20% from the height might be a good
opportunity to buy and keep for the long run. A good fundamental stock with
decent cash flow and low debt still preferable for me, but I am also allocating
some of my bullet to HKG Tech ETF as to capture the future growth in this
sector. I am not good in analyzing tech
company and not sure who will be the next Amazon or Google, so I will just buy
the ETF.
I am not sure if there will be any “sector rotation” from
Tech to Value stocks, but it seems that value stocks had also rebounded from
the low recently, of course some still far from pre-covid level. There might still be an opportunity to collect during any correction in this volatile market , unless we are talking about the risk of " catastrophic " type of lockdown again like the one happened in Mar 2020 due to mutation of the virus which affect the efficacy of current vaccine.
Happy Hunting & Chap Goh Mei !!

Cheers !
STE


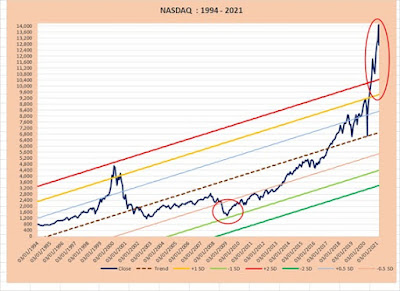
hi STE, im interested in the graphs you drew above with the lines showing 1SD , 2SD above and below average. would there be a website i can use to generate the same graphs for Singapore companies? Thanks in advance
ReplyDeleteHi MT,
DeleteI am not sure if there is any website providing such service since I plot this by myself using excel. If you want, I can forward you the sample file and you may download the company data you want to draw and plot the chart by yourself. Please send your e-mail id to stesg50@gmail.com if you want it. Cheers..