Want To Beat The Market ? You Need To Know This !
 |
| image credit to asymmetryobservation.com |
Would like to share this great article on the subject of “Regression to Trend/Mean”:
“About the only certainty in the stock market is
that, over the long haul, over performance turns into under-performance and vice
versa. Is there a pattern to this movement? Let's apply some simple regression
analysis (see footnote below) to the question.
Below is a chart of the S&P Composite stretching
back to 1871 based on the real (inflation-adjusted) monthly average of daily
closes. We're using a semi-log scale to equalize vertical distances for the
same percentage change regardless of the index price range.”
 |
| image credit to dshort.com |
As I mentioned before, although the market tends to reflect the
underlying economics or business factors in the long run but it does deviate from
time to time. Like what the great and father of “Value investors” Benjamin
Graham described in his famous phrase of “ Mr Market”, where sometimes market
could be very moody and overshooting or even very pessimistic at some point.
Regression to
the mean < from marketwatch.com>
Regression to
the mean," of course, refers to the tendency for things to even out over
time. Performance that is well above average usually doesn't stay there
forever; it usually comes back to earth. Performance that is well below average
often gets better.
This rule
doesn't mean that all advisers are equally good or equally bad. But it does
mean we should be wary of extrapolating particularly good or particularly bad
past performance into the future.”
As I blogged
before, I am using the deviation from the mean level to deploy my “war-chest” when
the "Standard Deviation (S.D) is hitting -1SD or -2SD level,
which will need one to have discipline and strong “mechanical “ type of mindset on when
to start deploying your war-chest. This is a more systematic way of deploying your
war-chest and may also avoid the predicament face by most investors that
using up all their war-chest too fast and too soon, seeing the market continue to drop without having money to buy eventually.


How About Using Regression Trend Line
for Individual Stocks?
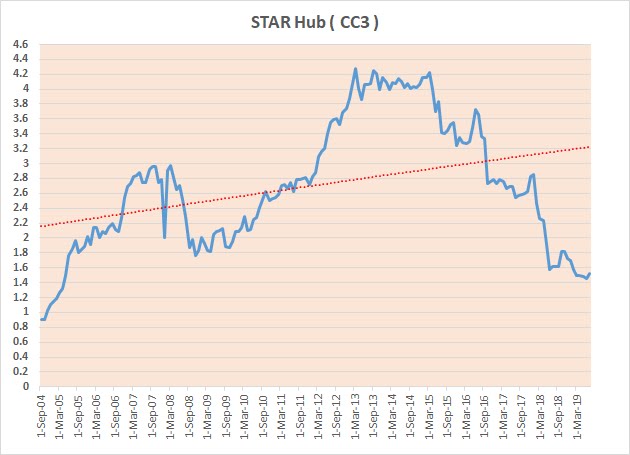
As I mentioned before, the regression line might be the best use to
spot the long term market trend as market tend to regress to mean in the long
run, but for individual stocks, it is too risky to use this as certain stocks
may not be able to recover to mean level due to fundamental change like
business environment or competition, two good examples will be SPH / Star Hub. Technology disruption in case of SPH and increase of competition for StarHub has simply changed their business fundamental which really affecting their revenue and profitability. Of course, the company continue to evolve at the same time, doing the corporate restructuring and business re-engineering, but the journey is long and tough, success is still a big question mark and yet to see.

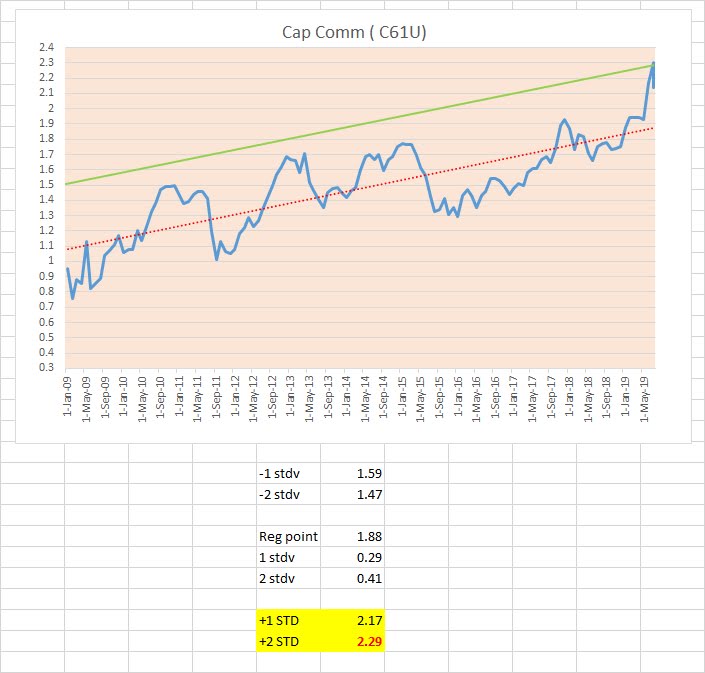
But with some exception, occasionally I do look at the current share
price vs mean level for certain stocks like Capital Commercial REIT. I sold
some of my CCT recently when the price hit $2.3 level which is close to +2SD
level. As we all know that REITs is like Bond + some Equity feature that growth
is quite stable and not like tech or others growth stocks that one may see the
revenue or profit jump exponentially in some quarters. Such cyclical and
bumpy revenue structure may reflect in their share price eventually. Unless REITs also have such profit characteristic, the share price shouldn't deviate much from the mean level in view of their consistency/stable growth rate, also a price of $2.3, the dividend yield dropped to 3.83% which is quite low and exceptional for me.
In my previous blog post (here
), I have highlighted that we are living in a very different generation with
those in 1960-90s as the market is much more volatile and with diminishing R.O.I,
sometimes, not only the time in the market but the timing is also important.
I am definitely not trying to advocate “short term trading”
like most of the trader but with these buy and sell, I look more like a “trader”
than “investor”.
What do you think?
Cheers !!
P.S: I would like to reiterate here that buying or selling of
stocks in your portfolio should still primarily base on the fundamental and underlying
business prospect as the trend line is just a “statistical phenomenon”.
Quote of The Day:
“If you want to have a better performance than
the crowd, you must do things differently from the crowd. “ Sir John
Templeton

CCT still very far away from reasonable cheap price.
ReplyDeleteHi Your Ka-ki,
DeleteYah, may be $1.90 is more reasonable ,...at mean level.
Cheers !! :D
Hi,
ReplyDeletewould you sharing how to create the +/- SD line in excel. Thanks.
Hi blackranchu,
DeleteYou may please kindly send your request to this e-mail ( stesg50@gmail.com) , I shall forward you the excel file on how plot the chart with some explanation.
Cheers !!
Hi NTS / J-NG/ KK/ KWC/ MATT
ReplyDeleteAs per request , have forwarded the sample file with some explanation on how to plot these regression chart. Also as mentioned , the regression line is to capture to long term market trend and valuation ( to some extend ) not to predict the future direction and definitely not suitable for short term trend reading or trading.
Hope it is useful , please feel free to contact me if you have any further inquiry.
Cheers !! :D
Hi William/Bryan/CS
ReplyDeleteThanks for reading my blog , as request , have forwarded the regression file in excel format to you per separate mail correspondence.
Hope it is useful , please feel free to contact me if you have any further inquiry.
Cheers !! :D
Hi SM/ TSOng/ KAT
ReplyDeleteThanks for reading my blog, as equest , have forwarded the regression file in excel format to you per separate mail correspondence.
Hope it is useful , please feel free to contact me if you have any further inquiry.
Cheers !! :D
Hi Wee/ J-wen/NAT / Aloha,
ReplyDeleteThanks for reading my blog, as request , have forwarded the regression file in excel format to you per separate mail correspondence.
Hope it is useful , please feel free to contact me if you have any further inquiry.
Cheers !! :D
Hi Matthew/ WIN/ VS,
ReplyDeleteThanks for reading my blog, as request , have forwarded the regression file in excel format to you per separate mail correspondence.
Hope it is useful , please feel free to contact me if you have any further inquiry.
Cheers !! :D